
Turning Geographic Data Into Actionable Insights
Combining geographic information systems, data analytics, and visual reporting to help organizations understand complex challenges and make informed decisions.
Our Approach
Making Complex Data More Accessible
Geographic information can reveal patterns and relationships that are difficult to identify through traditional reporting alone.
Our experience includes applying ArcGIS and analytical methodologies to examine factors affecting rural veteran communities.
Verve's role
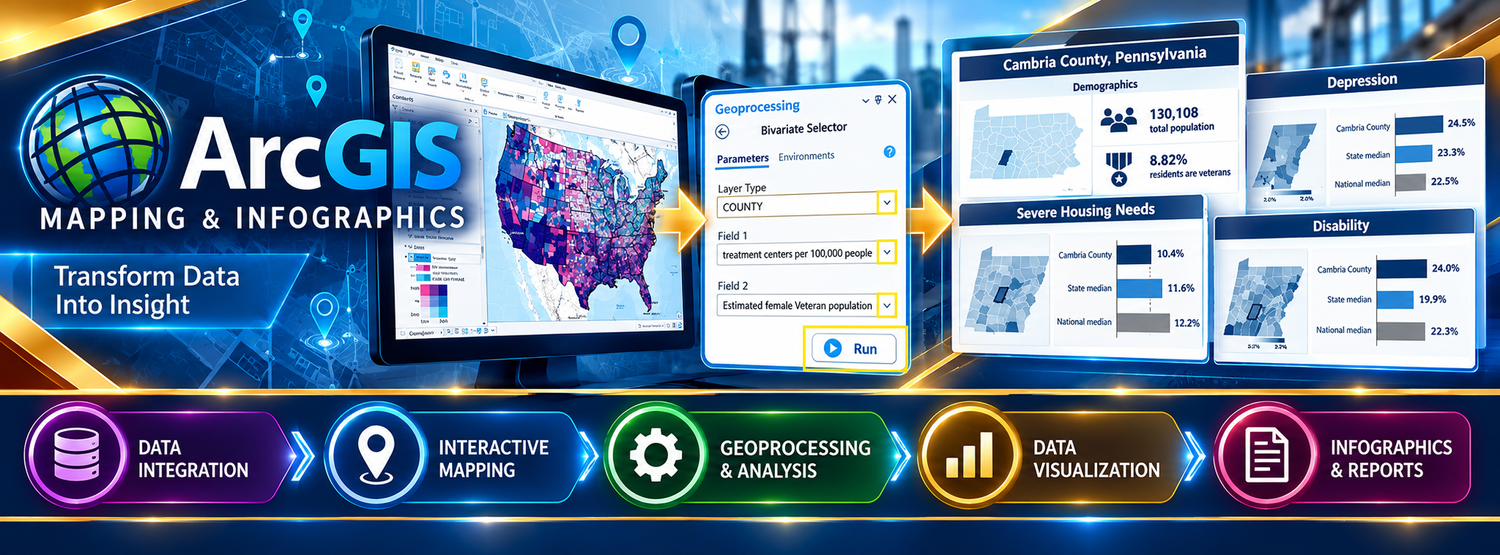
Verve integrates geospatial mapping, data analysis, and information visualization to help organizations better understand the geographic dimensions of complex issues.
Capabilities
Connecting Data, Geography, and Decision-Making
Geospatial Mapping
Visualizing geographic information to identify patterns, relationships, and regional differences.
Data Integration
Combining existing information from multiple sources to support comprehensive analysis.
Advanced Analytics
Applying analytical methodologies to examine complex data and support research.
Data Visualization
Creating maps and infographics that communicate findings in accessible visual formats.
Application
Supporting Rural Veteran Research
Through work supporting MIRECC, Verve contributes to data analysis and geographic mapping focused on suicide-related factors in rural veteran communities.
This work combines existing data with advanced analytical approaches to support research and improve the understanding of geographic and community-level factors.
Using ArcGIS mapping and visual reporting tools, complex datasets can be organized into accessible geographic visualizations that support further analysis.
Get Started
Discover What Your Data Can Reveal
Explore how Verve combines data analytics and geographic information systems to support research and organizational decision-making.